自分のデータを使用する
自分のデータを使用するにはconfigファイルを編集して自分のファイルフォーマットを指定します。
configファイルのサンプルは以下にあります。
{paplotをインストールしたディレクトリ}/example/example.cfg
[genome]
# ゲノムサイズのファイル(CSV形式)(デフォルトはhg19, installディレクトリ配下のgenomeディレクトリにあります)
#
# for example.
# (linux)
# path = ~/tmp/genome/hg19.csv
# (windows)
# path = C:\genome\hg19_part.csv
path =
[style]
# グラフのレイアウトファイル
# ~/tmp/paplot/style/rainbow.js
path =
# index.html の備考欄に出力するテキスト(HTMLタブ使用可)
remarks =
[sv]
# 使用するchromosomes (,で区切る)
use_chrs = 1,2,3,4,5,6,7,8,9,10,11,12,13,14,15,16,17,18,19,20,21,22,X,Y
[qc]
# qcでどのグラフを表示するか (表示しない場合Falseにする)
chart_coverage=True
chart_average=True
chart_mapped=True
chart_insert=True
chart_duplicate=True
chart_length=True
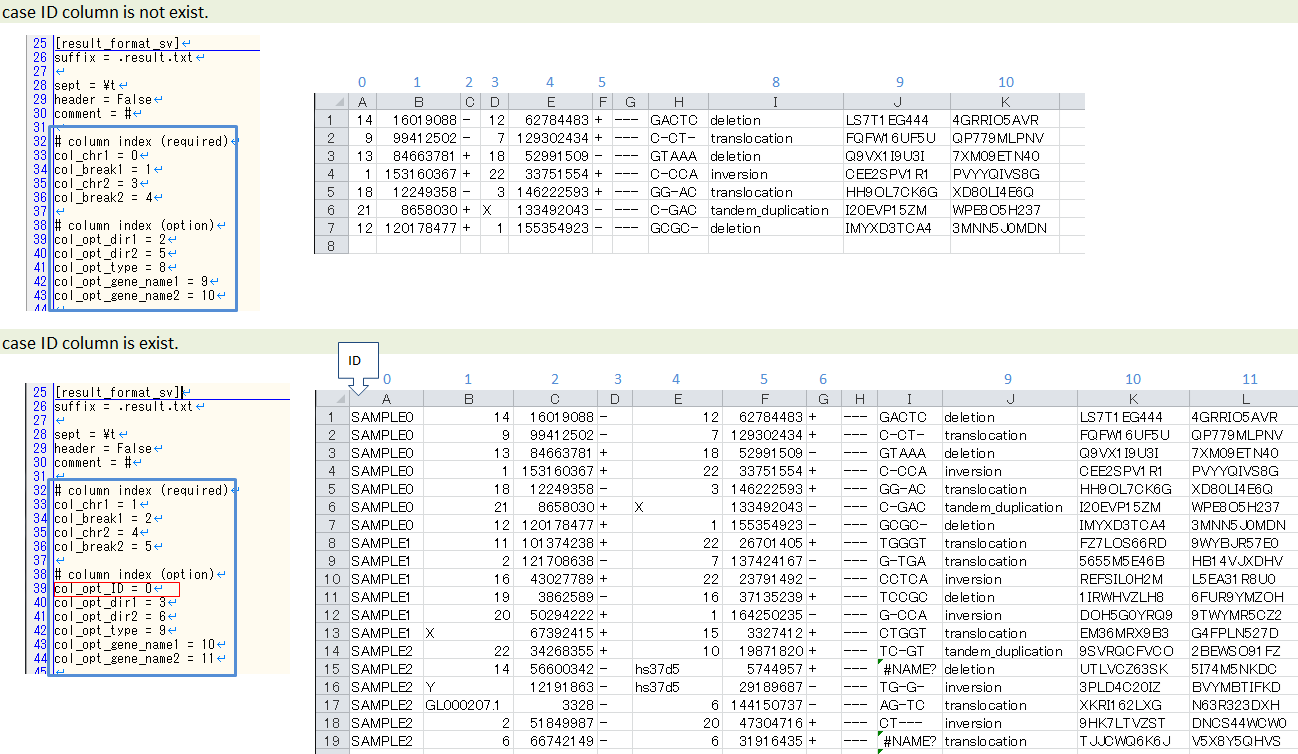
[result_format_sv]
# sv の入力ファイルフォーマット
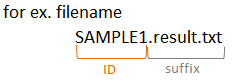
# suffix (col_pos_IDが指定されていない場合、ファイル名のsuffixより前をIDとする)
suffix = .result.txt
# データ区切り(タブ区切りの場合)
sept = \t
# ,区切りの場合
sept = ,
# スペース区切りの場合
sept = " "
# 先頭1行がヘッダかどうか (先頭行がヘッダの場合はTrue)
header = False
# 先頭に指定文字がある行は飛ばす
comment = #
##### データ列の位置
# ヘッダ行がある場合、カラム名 (テキスト) を入力する
# ヘッダ行がない場合、カラムインデックス (数値) を入力する
# 必須
col_chr1 = Chr_1
col_break1 = Pos_1
col_chr2 = Chr_2
col_break2 = Pos_2
# 任意
col_opt_dir1 = Dir_1
col_opt_dir2 = Dir_2
col_opt_type = Variant_Type
col_opt_gene_name1 = Gene_1
col_opt_gene_name2 = Gene_2
[result_format_qc]
# qc の入力ファイルフォーマット
# (svとほぼ同)
suffixとID
列と設定の対応
SVの場合
| name | input type | required | description |
|---|---|---|---|
| col_chr1 | text | o | chromosome of break point 1 |
| col_break1 | numeric | o | position of break point 1 |
| col_chr2 | text | o | chromosome of break point 2 |
| col_break2 | numeric | o | position of break point 2 |
| col_opt_ID | text | x | サンプルを識別できる名称 |
| col_opt_dir1 | text | x | direction of break point 1 |
| col_opt_dir2 | text | x | direction of break point 2 |
| col_opt_type | text | x | type of variation |
| col_opt_gene_name1 | text | x | gene name of break point 1 |
| col_opt_gene_name2 | text | x | gene name of break point 2 |
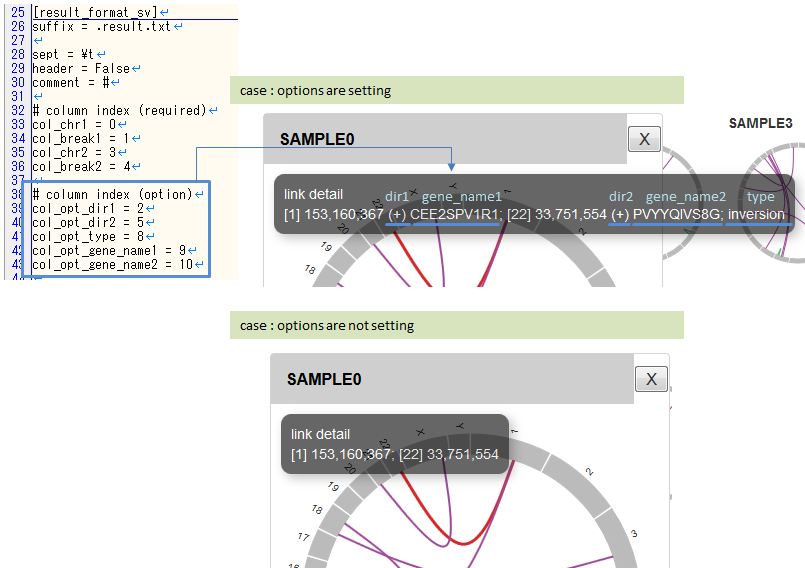
注釈
任意設定の5項目はポップアップでの詳細表示にのみ使用されます。
- col_opt_dir1
- col_opt_dir2
- col_opt_gene_name1
- col_opt_gene_name2
- col_opt_type
QCの場合
| name | input type | required | description |
|---|---|---|---|
| col_total_reads | numeric | o | number of total reads |
| col_mapped_reads | numeric | o | number of mapped reads |
| col_duplicate_reads | numeric | o | number of duplicate reads |
| col_mean_insert_size | numeric | o | mean of insert size |
| col_average_depth | numeric | o | average of depth |
| col_read_length_r1 | numeric | o | number of read_length_r1 |
| col_read_length_r2 | numeric | o | number of read_length_r2 |
| col_ratio_2x | 0.0~1.0 | o | coverage (depth=2) |
| col_ratio_10x | 0.0~1.0 | o | coverage (depth=10) |
| col_ratio_20x | 0.0~1.0 | o | coverage (depth=20) |
| col_ratio_30x | 0.0~1.0 | o | coverage (depth=30) |
| col_opt_ID | text | x | サンプルを識別できる名称 |
作成したconfigファイルは pa_plot コマンドの --config_file オプションで指定します。
実行例
pa_plot qc "example/qc/*.csv" ./tmp DUMMY --config_file example/example.cfg