quick start
- paplotをインストール
- testサンプルでコマンドを実行
- 結果ファイルを表示
1. paplotをインストール
git clone -b master https://github.com/Genomon-Project/paplot.git
cd paplot

python setup.py build install --user
installの確認
以下を入力してください。
pa_plot conf
このように表示されればインストール成功です。
**********************
   hello paplot !!!
**********************

config file:/usr/lib/python2.7/site-packages/paplot-0.2.6devel-py2.7.egg/config/paplot.cfg
[genome]
('path', '')
[style]
('path', '')
[sv]
('use_chrs', '1,2,3,4,5,6,7,8,9,10,11,12,13,14,15,16,17,18,19,20,21,22,X,Y')
('snippet_threshold', '1000')
(このあとにデフォルト設定の内容が表示されます)
2. testサンプルでコマンドを実行
テストサンプルを用意していますので実行します。
cd {paplotをインストールしたディレクトリ}
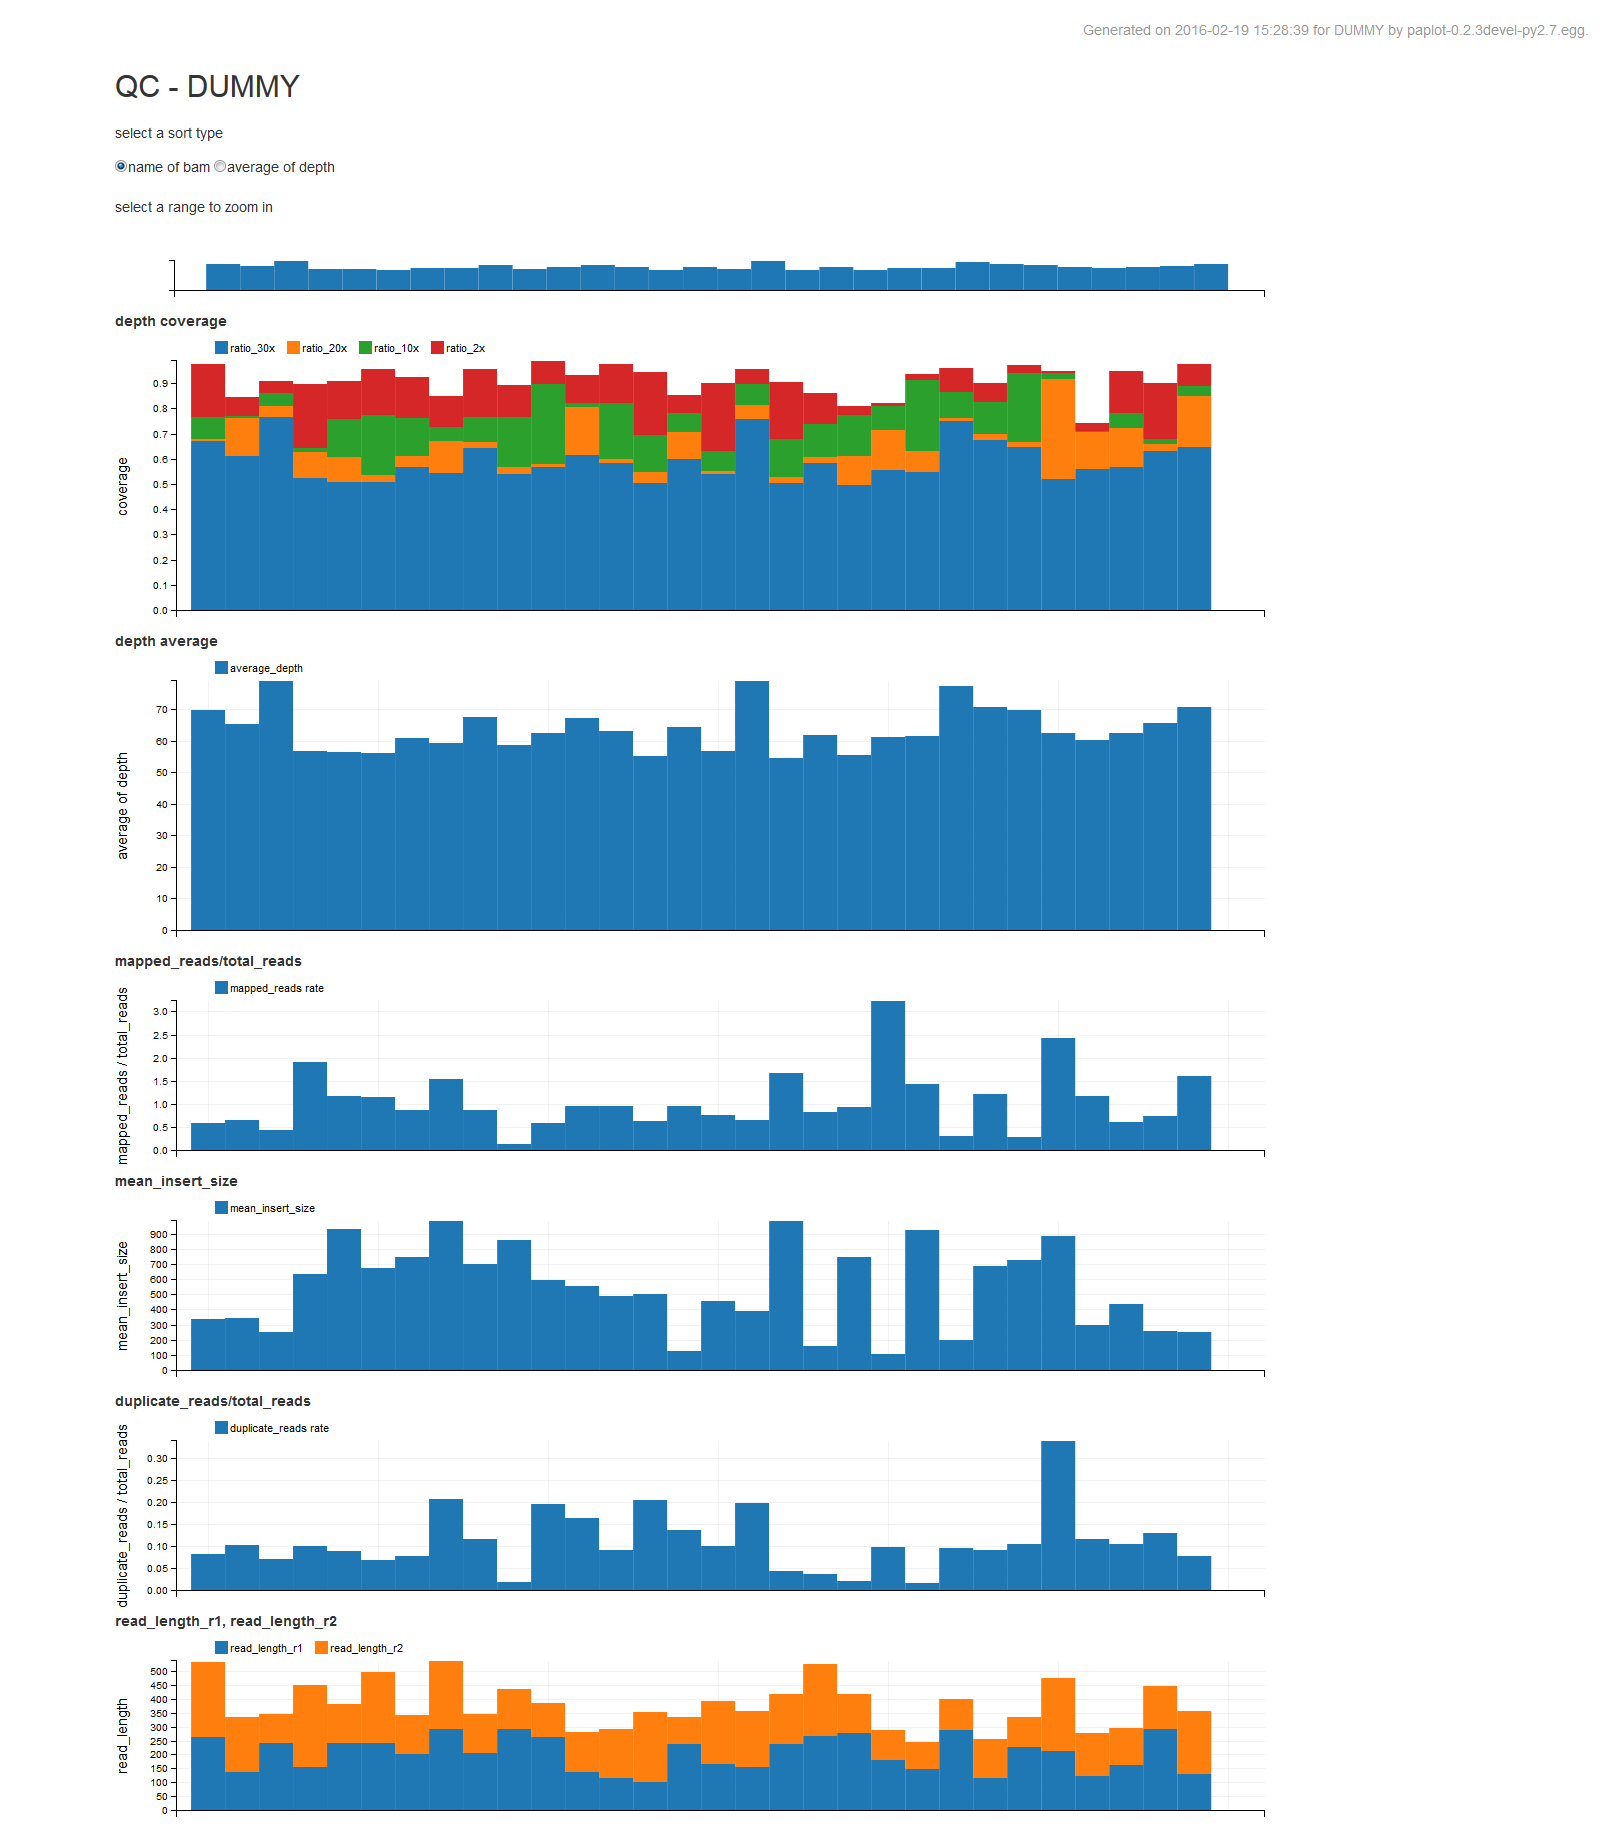
# create bar graphs of qc
pa_plot qc "example/qc/*.csv" ./tmp DUMMY --config_file example/example.cfg
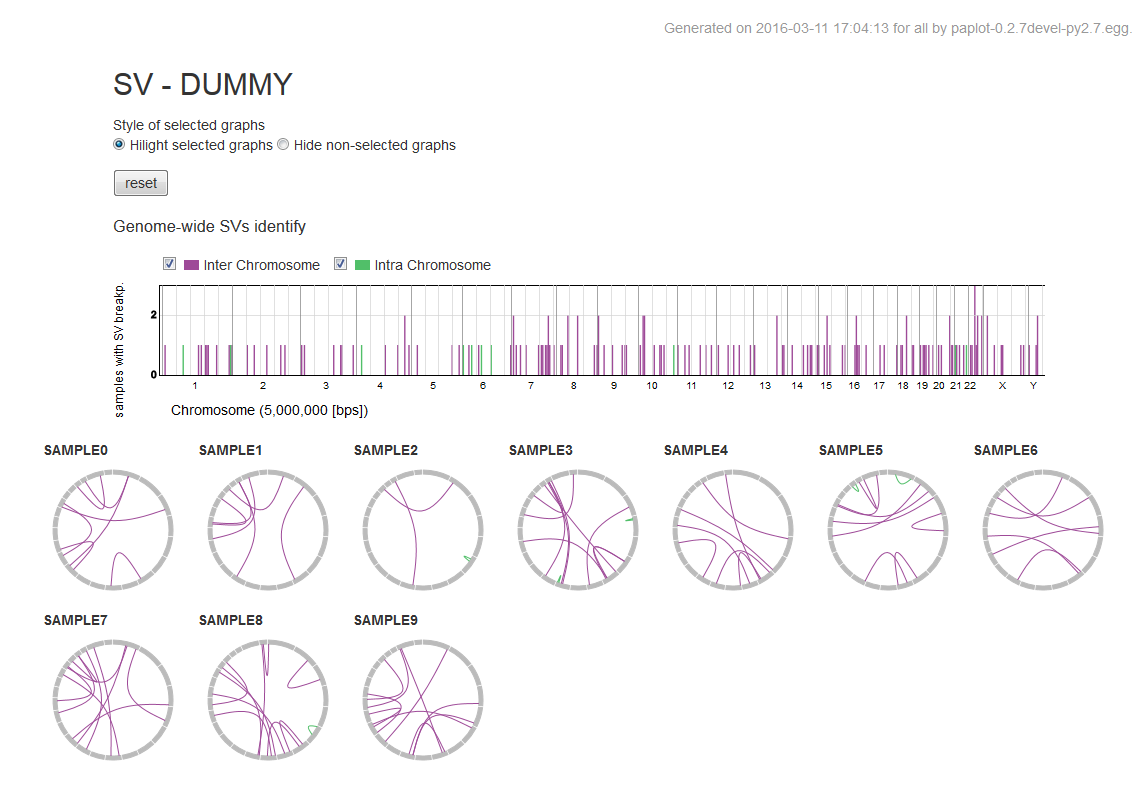
# create bundle graphs of Structural Variation (SV)
pa_plot sv "example/sv/*.txt" ./tmp DUMMY --config_file example/example.cfg
3. 結果ファイルを表示
次の場所にHTMLファイルが2つできていますか?
{paplot をインストールしたディレクトリ}
  └ tmp
      ├ DUMMY
      │   ├ graph_qc.html     <--- qc グラフ
      │   └ graph_sv.html     <--- sv グラフ
      │
      ├ js          <--- この3つのディレクトリはHTMLファイルを表示するために必要です。消さないでください。
      ├ lib
      └ style
HTMLファイルを web ブラウザで開いてください。
※HGCスパコン等、サーバ上で実行した場合はファイルをローカルに転送するか、サーバ上の仮想ウィンドウ(NoMachime等)で表示してください。
ローカルに転送する場合は、
tmp ディレクトリを丸ごとコピーしてください。次のように見えていますか?
それぞれのグラフの使い方は How to use を参照してください。