Chromosomal Aberration Report
Here, we describe the procedure to generate Chromosomal Aberration Report using sample data [*].
| [*] | The sample data is equipped with the example directory of the paplot directory. |
1. Minimal dataset
For generating Chromosomal Aberration Report using paplot, at least the following five items are necessary:
- Sample ID (Sample)
- Chromosome of the breakpoint 1 (Chr1)
- Coordinate of the breakpoint 1 (Break1)
- Chromosome of the breakpoint 2 (Chr2)
- Coordinate of the breakpoint 2 (Break2)
Sample,Chr1,Break1,Chr2,Break2,
SAMPLE1,14,16019088,12,62784483,
SAMPLE1,9,99412502,7,129302434,
SAMPLE1,13,84663781,18,52991509,
SAMPLE2,11,101374238,22,26701405,
SAMPLE2,2,121708638,7,137424167,
SAMPLE3,22,34268355,10,19871820,
SAMPLE3,8,107868940,hs37d5,20517614,
SAMPLE4,8,135644313,3,116748248,
SAMPLE4,7,6037836,21,34855497,
SAMPLE4,7,109724564,14,106387943,
Set the column names in the [result_format_ca] section of the configuration file.
[result_format_ca]
col_chr1 = Chr1
col_break1 = Break1
col_chr2 = Chr2
col_break2 = Break2
col_opt_id = Sample
Then, execute the paplot.
paplot ca {unzip_path}/example/ca_minimal/data.csv ./tmp ca_minimal \
--config_file {unzip_path}/example/ca_minimal/paplot.cfg
2. Without header
SAMPLE00,intronic,GATA3
SAMPLE00,UTR3,CDH1
SAMPLE00,exonic,GATA3
SAMPLE01,splicing,WASF3
SAMPLE01,intronic,WASF3
SAMPLE01,exonic,NRAS
SAMPLE02,intronic,FBXW7
SAMPLE02,intronic,GATA3
SAMPLE02,ncRNA_intronic,ACVR2B
SAMPLE03,exonic,CAP2
SAMPLE03,intronic,PIK3CA
SAMPLE03,downstream,SEPT12
When the input data has no header (column names), it is necessary to set the column number to each key in the [result_format_ca] section of the configuration file.
[result_format_ca]
# Set the value of the header option to False
header = False

col_chr1 = 2
col_break1 = 3
col_chr2 = 4
col_break2 = 5
col_opt_id = 1
Then execute paplot.
paplot ca {unzip_path}/example/ca_noheader/data.csv ./tmp ca_noheader \
--config_file {unzip_path}/example/ca_noheader/paplot.cfg
3. Customizing categorization
In the minimal dataset, chromosomal aberrations are categorized into intra-chromosomal (green) and inter-chromosomal (purple). We can customize the categorization.
Sample,Chr1,Break1,Chr2,Break2,Label
SAMPLE1,14,16019088,12,62784483,C
SAMPLE1,9,99412502,7,129302434,B
SAMPLE1,13,84663781,18,52991509,A
SAMPLE2,11,101374238,22,26701405,B
SAMPLE2,2,121708638,7,137424167,C
SAMPLE2,16,43027789,22,23791492,C
SAMPLE3,22,34268355,10,19871820,A
SAMPLE3,14,56600342,hs37d5,5744957,B
SAMPLE3,Y,12191863,hs37d5,29189687,A
SAMPLE4,8,135644313,3,116748248,D
SAMPLE4,7,6037836,21,34855497,D
SAMPLE4,7,109724564,14,106387943,A
In the example data above, a new column, Label, is included apart from Sample, Chr1, Break1, Chr2, and Break2.
First, we set the Label as the column used for categorization in the [result_format_ca] section in the configuration file.
[result_format_ca]
col_opt_group = Label
Moreover, the color for each category can be set.
[ca]
# Set {Value}:{the name of color or RGB value} for each category and join them by comma ','.
group_color = A:#66C2A5,B:#FC8D62,C:#8DA0CB,D:#E78AC3

# Only categories registered below will be displayed.
limited_group =

# Categories registered below will not be displayed.
nouse_group =
Then, execute paplot.
paplot ca {unzip_path}/example/ca_group/data.csv ./tmp ca_group \
--config_file {unzip_path}/example/ca_group/paplot.cfg
4. Customizing pop-up information
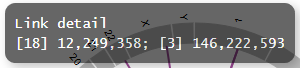
We can customize the pop-up information that appears upon mouseover events. In the minimal dataset, the pop-up information is displayed as illustrated below:
Before customization
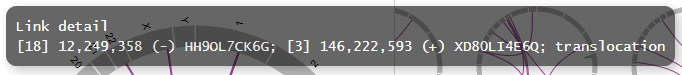
By customizing the pop-up information, we can view more detailed information on each chromosomal aberration.
After customization
Sample,Chr1,Break1,Dir1,Chr2,Break2,Dir2,MutationType,Gene1,Gene2
SAMPLE1,14,16019088,-,12,62784483,+,deletion,LS7T1EG444,4GRRIO5AVR
SAMPLE1,9,99412502,-,7,129302434,+,translocation,FQFW16UF5U,QP779MLPNV
SAMPLE1,13,84663781,+,18,52991509,-,deletion,Q9VX1I9U3I,7XM09ETN40
SAMPLE1,1,153160367,+,22,33751554,+,inversion,CEE2SPV1R1,PVYYQIVS8G
SAMPLE1,18,12249358,-,3,146222593,+,translocation,HH9OL7CK6G,XD80LI4E6Q
SAMPLE1,21,8658030,+,X,133492043,-,tandem_duplication,I20EVP15ZM,WPE8O5H237
SAMPLE1,12,120178477,+,1,155354923,-,deletion,IMYXD3TCA4,3MNN5J0MDN
SAMPLE2,11,101374238,+,22,26701405,+,translocation,FZ7LOS66RD,9WYBJR57E0
SAMPLE2,2,121708638,-,7,137424167,-,translocation,5655M5E46B,HB14VJXDHV
SAMPLE2,16,43027789,+,22,23791492,-,inversion,REFSIL0H2M,L5EA31R8U0
SAMPLE2,19,3862589,-,16,37135239,+,deletion,1IRWHVZLH8,6FUR9YMZOH
SAMPLE2,20,50294222,+,1,164250235,-,inversion,DOH5G0YRQ9,9TWYMR5CZ2
SAMPLE2,X,67392415,+,15,3327412,+,translocation,EM36MRX9B3,G4FPLN527D
SAMPLE3,22,34268355,+,10,19871820,+,tandem_duplication,9SVRQCFVCO,2BEWSO91FZ
In this example, the following five (optional) columns are incorporated apart from the five required columns:
- Mutation type (MutationType)
- Gene affected by the breakpoint 1 (Gene1)
- Gene affected by the breakpoint 2 (Gene2)
- Direction of the breakpoint 1 (Dir1)
- Direction of the breakpoint 2 (Dir2)
First, add these columns to the [result_format_ca] section in the configuration file.
[result_format_ca]
col_opt_dir1 = Dir1
col_opt_dir2 = Dir2
col_opt_type = MutationType
col_opt_gene_name1 = Gene1
col_opt_gene_name2 = Gene2
col_opt_dir1 = Dir1
col_opt_dir2 = Dir2
The column names of the optional items can be set as col_opt_{keyword} = {actual column name}.
For a more detailed description on keyword, please refer to About keyword.
Then, modify the [ca] section in the configuration file.
[ca]
# before customization
# tooltip_format = [{chr1}] {break1:,}; [{chr2}] {break2:,}
# after customization
tooltip_format = [{chr1}] {break1:,} ({dir1}) {gene_name1}; [{chr2}] {break2:,} ({dir2}) {gene_name2}; {type}
Then, execute paplot.
paplot ca {unzip_path}/example/ca_option/data.csv ./tmp ca_option \
--config_file {unzip_path}/example/ca_option/paplot.cfg
For a more detailed description on the procedure to set pop-up information (tooltip_format), please refer to User defined format.