Quality Control (QC) Report
QC Report displays qualities of each sequence data, such as sequence depth and coverage, mapping ratio, and duplicate ratio.
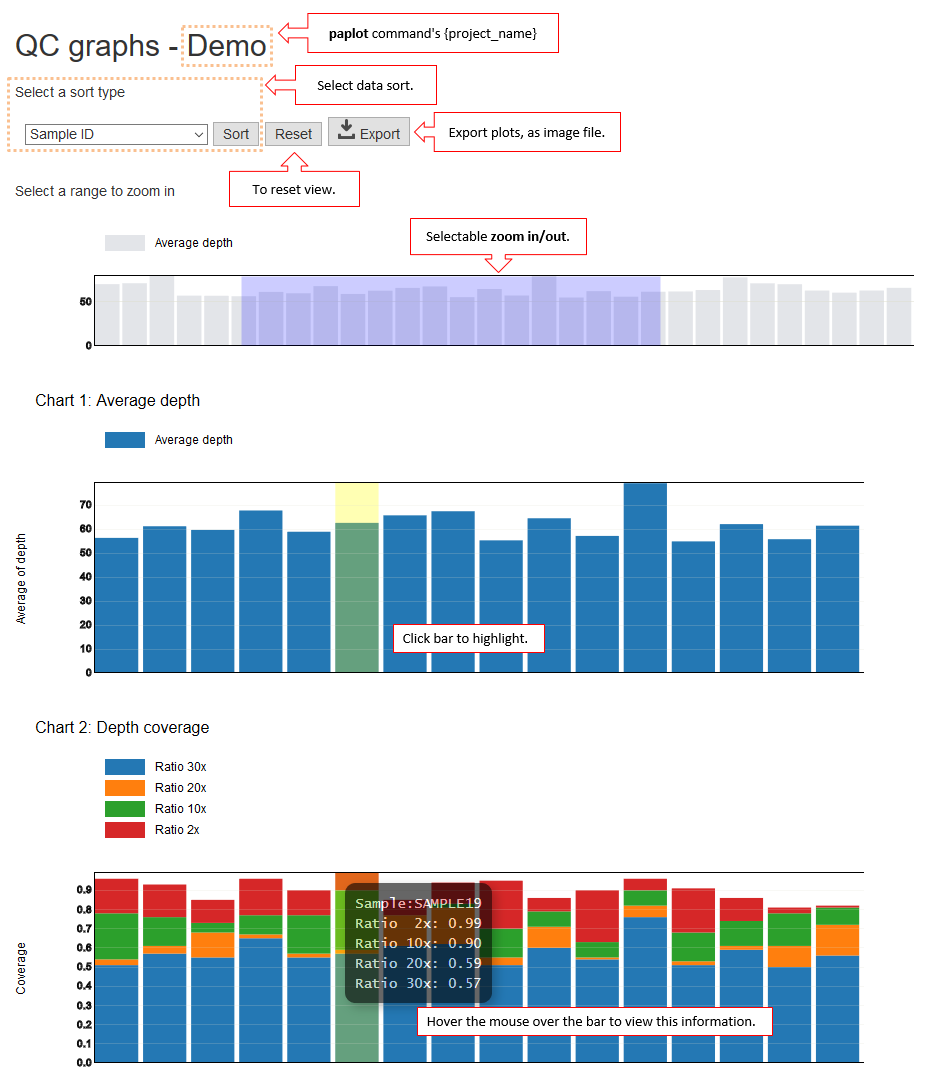
When mousing over each bar, detailed information for each sample and property will be displayed as pop-ups.
Barplot of light grey color at the top shows the average depth of each sequence data. [*]
By selecting the range in this panel, you can zoom in all the graphs below so that just an easily viewable number of samples are highlighted.
| [*] | The graph for selecting samples can be changed by using the configuration files. Please refer to Graph for selecting samples . |