pmsignature Report
Here, we show describe the procedure generate pmsignature Report using sample data [*].
[*] the sample data is equipped with the exampledirectory of the paplot directory.
We are publishing the docker image experimentally. https://hub.docker.com/r/aokad/pmsignature/
1. Input data format
To generate pmsignature Report using paplot, json format input data is required.
{
  "ref":[
          [ # pmsignature 1
            [0.338,0.15,0.183,0.327],  # ref1 (A,C,G,T)
            [0.362,0.191,0.177,0.267], # ref2 (A,C,G,T)
            [0,0.731,0,0.268],         # ref3 (A,C,G,T)
            [0.31,0.165,0.251,0.272],  # ref4 (A,C,G,T)
            [0.295,0.193,0.168,0.341]  # ref5 (A,C,G,T)
          ],
          [ # pmsignature 2
            [0.179,0.414,0.084,0.321],
            [0.007,0.025,0.004,0.962],
            [0,0.999,0,0],
            [0.472,0.104,0.041,0.381],
            [0.277,0.175,0.284,0.262]
          ]
        ],
  "alt":[
          [ # pmsignature 1
            [0,0,0,0],                 # altA (A,C,G,T)
            [0.194,0,0.091,0.445],     # altC (A,C,G,T)
            [0,0,0,0],                 # altG (A,C,G,T)
            [0.093,0.163,0.011,0]      # altT (A,C,G,T)
          ],
          [ # pmsignature 2
            [0,0,0,0],
            [0.059,0,0.437,0.502],
            [0,0,0,0],
            [0,0,0,0]
          ]
        ],
  "strand":[
            [0.461,0.538],  # pmsignature 1
            [0.512,0.487]   # pmsignature 2
           ],
  "id":["PD3851a","PD3890a","PD3904a"],
  "mutation":[[0,0,0.535],[0,1,0.038],[0,2,0.426],[1,0,0.186],[1,1,0.156],[1,2,0.656]],
  "mutation_count":[702,2312,2096]
}
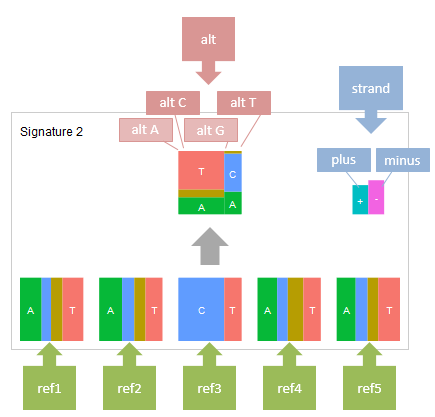
Elements of the input data for pmsignature Report
| ref: | Values of reference bases (in the order of A, C, G, T) for each mutation signature.
Not necessarily sum-to-one (normalized within the program).
In this example, the number of bases is five. However, this number can be changed to any arbitrary odd number (e.g., 3, 7).
|
|---|---|
| alt: | Values for alternative base (in the order of A, C, G, T for each central reference base) for each mutation signature.
Four values (in the order of A, C, G, T) for each reference base A, C, G, and T. Therefore, in total 16 values are required for each mutation signature.
Usually, the central base is fixed to C or T. Therefore, the values whose reference bases are A or G contribute negligibly to the visualization (and thus can be set to zero).
|
| strand: | Values for the strand (in the order of plus and minus) for each mutation signature.
When strand biasness is not taken into account, set
[0, 0]. |
Elements for signature contribution graph
This graph is optional.
Signature contribution graph presents the amount of mutations associated with each mutation signature. When id, mutation, and mutation_count are set in the input json file, the signature contribution graph is generated (example).
| id: | List of samples. For each sample, sample indices are assigned (in this example, PD3851a = 0, PD3890a = 1, PD3904a = 2, etc.).
|
|---|---|
| mutation_count: | The number of mutations for each sample (in this example, the mutation number for PD3851a = 702, that for PD3890a = 2312, etc.).
|
| mutation: | Contribution ratio of each mutation signature to each sample ([sample index, signature index, value]).
The indices for mutation signature (signature index) are assigned in the listed order in the signature key.
In the above example, (signature1 = 0, signature2 = 1, signature3 = 2).
|
Note
The keys in the input json file can be modified by changing the contents in the [result_format_pmsignature] section of the configuration file.
[result_format_pmsignature]
format = json
background = True
key_ref = ref
key_alt = alt
key_strand = strand
key_id = id
key_mutation = mutation
key_mutation_count = mutation_count
Note
The procedure to validate json file format
paplot using json python package. When loading the input file using load function from json package, then the input file is valid json format.
For e.g., when the file fine name is “data2.json”.
$ python
>>> import json
>>> json.load(open("data2.json"))
2. Minimal dataset
For the format of input data, please refer to 1. Input data format.
{
  "ref":[[[0.189,0.395,0.088,0.326],[0.019,0.029,0.01,0.94],[0,0.999,0,0],[0.467,0.103,0.054,0.374],[0.278,0.175,0.276,0.268]]],
  "alt":[[[0,0,0,0],[0.063,0,0.415,0.521],[0,0,0,0],[0,0,0,0]]],
  "strand":[[0.514,0.485]]
}
Configuration file
[pmsignature]
tooltip_format_ref1 = A: {a:.2}
tooltip_format_ref2 = C: {c:.2}
tooltip_format_ref3 = G: {g:.2}
tooltip_format_ref4 = T: {t:.2}
tooltip_format_alt1 = C -> A: {ca:.2}
tooltip_format_alt2 = C -> G: {cg:.2}
tooltip_format_alt3 = C -> T: {ct:.2}
tooltip_format_alt4 = T -> A: {ta:.2}
tooltip_format_alt5 = T -> C: {tc:.2}
tooltip_format_alt6 = T -> G: {tg:.2}
tooltip_format_strand = + {plus:.2} - {minus:.2}

color_A = #06B838
color_C = #609CFF
color_G = #B69D02
color_T = #F6766D
color_plus = #00BEC3
color_minus = #F263E2

[result_format_pmsignature]
format = json
background = True
key_ref = ref
key_alt = alt
key_strand = strand
Execute paplot.
paplot pmsignature pmsignature_minimal/data.json ./tmp pmsignature_minimal \
--config_file ./pmsignature_minimal/paplot.cfg
Then, the report is generated in the tmp directory.
Here, the file names (graph_pmsignature2.html) are determined by the number of mutation signatures (interpreted automatically from the input data).
./tmp
  ┗ pmsignature_minimal
      ┗ graph_pmsignature2.html
Note
Since one signature is assigned to background signature in this example, the last signature in the contribution graph is background signature.
3. Mutation signature with multiple numbers of signatures
For the format of input data, please refer to 1. Input data format.
The input data for each signature number and configuration file are required for generating Mutation Signature Report with various numbers of signatures.
In this example dataset, following files are prepared.
example/pmsignature_multi_class/

   # Input data files
  ┣ data2.json  # pmsignature num = 2
  ┣ data3.json  # pmsignature num = 3
  ┣ data4.json  # pmsignature num = 4
  ┣ data5.json  # pmsignature num = 5
  ┣ data6.json  # pmsignature num = 6

   # Configuration file
  ┗ paplot.cfg
Execute paplot for each mutation signature number.
paplot pmsignature pmsignature_multi_class/data2.json ./tmp pmsignature_multi_class \
--config_file ./pmsignature_multi_class/paplot.cfg

paplot pmsignature pmsignature_multi_class/data3.json ./tmp pmsignature_multi_class \
--config_file ./pmsignature_multi_class/paplot.cfg

paplot pmsignature pmsignature_multi_class/data4.json ./tmp pmsignature_multi_class \
--config_file ./pmsignature_multi_class/paplot.cfg

paplot pmsignature pmsignature_multi_class/data5.json ./tmp pmsignature_multi_class \
--config_file ./pmsignature_multi_class/paplot.cfg

paplot pmsignature pmsignature_multi_class/data6.json ./tmp pmsignature_multi_class \
--config_file ./pmsignature_multi_class/paplot.cfg
Or, execute the following batch command.
paplot pmsignature "pmsignature_multi_class/data*.json" ./tmp pmsignature_multi_class \
--config_file ./pmsignature_multi_class/paplot.cfg
Then, the report is generated in the tmp directory.
Here, the file names (graph_pmsignature2.html) are determined by the number of mutation signatures (interpreted automatically from the input data).
./tmp
  ┗ pmsignature_multi_class
      ┣ graph_pmsignature2.html
      ┣ graph_pmsignature3.html
      ┣ graph_pmsignature4.html
      ┣ graph_pmsignature5.html
      ┗ graph_pmsignature6.html
Note
Since one signature is assigned to background signature in this example, the last signature in the contribution graph is background signature.
4. Signature contribution graph
Here, we add a signature contribution graph.
For the format of input data, please refer to 1. Input data format.
For generating report with various signature numbers, please refer to 3. Mutation signature with multiple numbers of signatures.
Execute paplot.
paplot pmsignature "pmsignature_stack/data*.json" ./tmp pmsignature_stack \
--config_file ./pmsignature_stack/paplot.cfg
Note
Since one signature is assigned to background signature in this example, the last signature in the contribution graph is background signature.
5. Without background
Here, we generate a pmsignature Report without background.
Set the background option to False in the configuration file.
[result_format_pmsignature]
background = False
Then, execute paplot.
paplot pmsignature pmsignature_nobackground/data.json ./tmp pmsignature_nobackground \
--config_file ./pmsignature_nobackground/paplot.cfg