Mutational Signature Report
Mutational Signature Report displays the “mutation signature” (see e.g., Alexandrov et al., Nature, 2013) as bargraphs and the estimated “contributions” of each signature to the mutations per samples as stacked bar graphs.
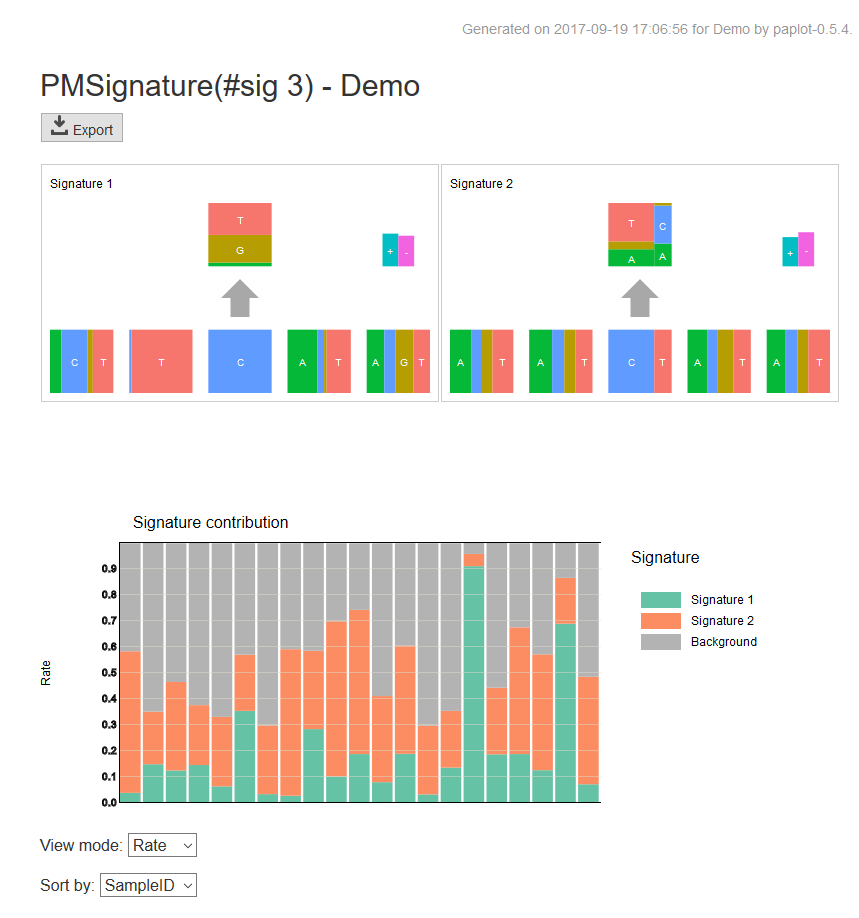
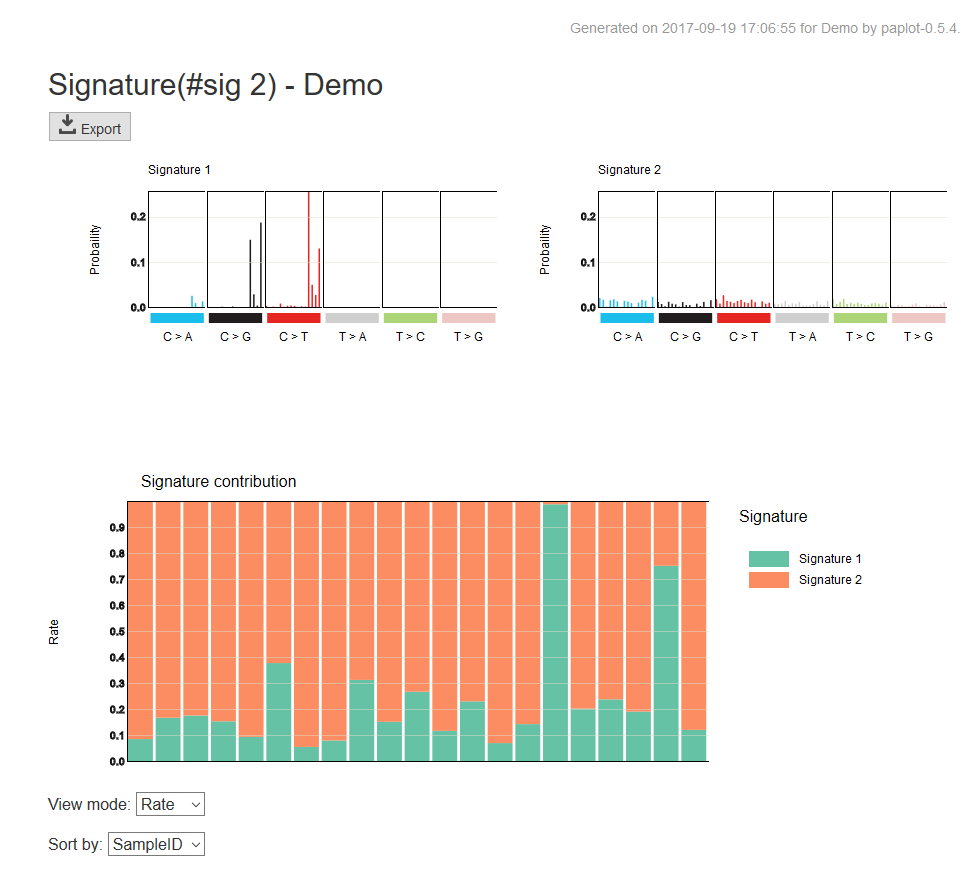
| Upper panel (mutation signature graph): | |
|---|---|
Mutation signatures are displayed (typically by barplots with 96 elements).
|
|
| Lower panel (signature contribution graph): | |
For each sample, the ratios of contributions of mutation signatures to the mutations are displayed.
|
|
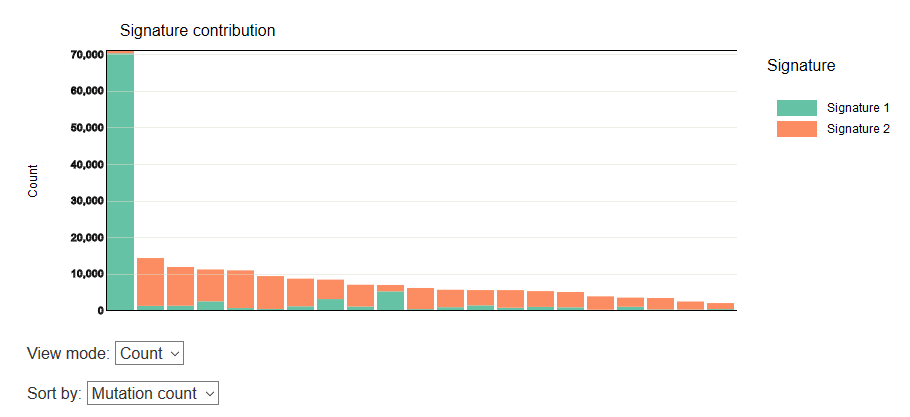
In addition, you can change the display mode using the list box below the stacked graph.
| View mode: |
|
||||
|---|---|---|---|---|---|
| Sort by: |
|
Display example when the view mode is [Count] and sorting is by [Mutation count].
A similar representation is adopted for the case with pmsignature.