QC Report
Here, we describe the procedure to generate QC report using sample data [*].
| [*] | The sample data is equipped with the example directory of the paplot directory. |
1. Minimal dataset
For generating QC Report using paplot, sample ID (Sample) and QC items (at least one) are required. In this example, we adopt mean sequence depth (AverageDepth).
Sample,AverageDepth
SAMPLE1,70.0474
SAMPLE2,65.7578
SAMPLE3,63.3750
SAMPLE4,70.9654
SAMPLE5,69.9653
First, set the column names in the [result_format_qc] section of the configuration file.
[result_format_qc]
col_opt_id = Sample
col_opt_key1 = AverageDepth
The column names of optional items can be set as col_opt_{keyword} = {actual column name}.
For a more detailed description on keyword, please refer to About keyword.
Then, add the [qc_chart_1] section to the configuration file and fill the contents within it.
[qc_chart_1]

# Title of the graph
title = Average depth

# Label of the Y axis
title_y = Average of depth

# Items for the stacked bargraph
# In this example, only one item is used and the graph is displayed as non-stacked bargraph
stack1 = {key1}

# Color and legend of the graph
name_set = Average depth:#2478B4

# Pop-up information
tooltip_format1 = Sample:{id}
tooltip_format2 = {key1:.2}
Note
Here, {key1} used above is the {keyword} specified in the [result_format_qc] section.
- For a more detailed description on the procedure to set
name_set, please refer to How to set name_set. - For a more detailed description on the procedure to set
tooltip_format, please refer to User defined format.
Then, execute paplot.
paplot qc {unzip_path}/example/qc_minimal/data.csv ./tmp qc_minimal \
--config_file {unzip_path}/example/qc_minimal/paplot.cfg
2. Without header
SAMPLE1,70.0474
SAMPLE2,65.7578
SAMPLE3,63.3750
SAMPLE4,70.9654
SAMPLE5,69.9653
When the input data has no header (column names), it is necessary to set the column number to each key in the [result_format_qc] section of the configuration file.
[result_format_qc]
# Set the value of the header option to False
header = False

col_opt_id = 1
col_opt_average_depth = 2
Then, execute paplot.
paplot qc {unzip_path}/example/qc_noheader/data.csv ./tmp qc_noheader \
--config_file {unzip_path}/example/qc_noheader/paplot.cfg
3. Stacked bargraph
Here, we generate a report with a stacked bargraph as well as a normal bargraph (generated in the minimal dataset example).
Sample,AverageDepth,ReadLengthR1,ReadLengthR2
SAMPLE1,70.0474,265,270
SAMPLE2,65.7578,140,200
SAMPLE3,63.375,120,175
SAMPLE4,70.9654,120,140
SAMPLE5,69.9653,230,110
- chart_1 [normal bargraph] AverageDepth (the same as the minimal dataset example)
- chart_2 [stacked bargraph] ReadLengthR1, ReadLengthR2
First, add these columns to the [result_format_qc] section in the configuration file.
[result_format_qc]
col_opt_id = Sample

# Column used in the chart_1
col_opt_keyA1 = AverageDepth

# Column used in the chart_2
col_opt_keyB1 = ReadLengthR1
col_opt_keyB2 = ReadLengthR2
The column names of optional items can be set as col_opt_{keyword} = {actual column name}.
For a more detailed description on keyword, please refer to About keyword.
Next, add the [qc_chart_1], and [qc_chart_2] sections to the configuration file and fill the contents within it.
[qc_chart_*] sections.*, which should start from 1.For the completed configuration file, please refer to example/qc_stack/paplot.cfg.
3-1. Normal bargraph
The [qc_chart_1] section is for a normal bargraph, and the contents should be filled as in the minimal dataset example.
3-2. Stacked bargraph
The [qc_chart_2] section is for a stacked bargraph.
[qc_chart_2]

# Titles
title = Chart 2: Read length
title_y = Read length

# Items for the stacked bargraph
# Items are stacked in the order of stack1 → 2 → ...
stack1 = {keyB1}
stack2 = {keyB2}

# Color and legend
# Write down in the order of stack1 → 2 → ..., and join them by commas ','.
name_set = Read length r1:#2478B4, Read length r2:#FF7F0E

# Pop-up information
tooltip_format1 = Sample:{id}
tooltip_format2 = Read1: {keyB1:,}
tooltip_format3 = Read2: {keyB2:,}
Note
Here, {key*} used above is the {keyword} specified in the [result_format_qc] section.
- For a more detailed description on the procedure to set
name_set, please refer to How to set name_set. - For a more detailed description on the procedure to set
tooltip_format, please refer to User defined format.
Then, execute paplot.
paplot qc {unzip_path}/example/qc_multi_plot/data.csv ./tmp qc_multi_plot \
--config_file {unzip_path}/example/qc_multi_plot/paplot.cfg
3-3. How to set name_set
Define the legends and their colors.
Write {legend}:{color} for each item in the stacked bargraph (colors can be omitted).
name_set = average_depth:#2478B4

# When there are multiple items, join them by commas ','.
name_set = Read length r1:#2478B4, Read length r2:#FF7F0E
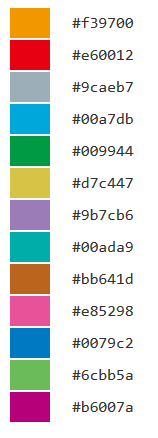
When colors are omitted, the default colors defined in the following file are used:
4. Various graphs
In the previous example, we generated a report with one normal bargraph and one stacked bargraph. Here, we generate more graphs.
Sample,AverageDepth,ReadLengthR1,ReadLengthR2,TotalReads,MappedReads,2xRatio,10xRatio,20xRatio,30xRatio
SAMPLE1,70.0474,265,270,94315157,56262203,0.9796,0.768,0.6844,0.6747
SAMPLE2,65.7578,140,200,50340277,33860998,0.8489,0.7725,0.7655,0.6131
SAMPLE3,63.375,120,175,90635480,88010999,0.9814,0.8236,0.6045,0.5889
SAMPLE4,70.9654,120,140,72885114,89163960,0.9047,0.8303,0.7032,0.6801
SAMPLE5,69.9653,230,110,92572101,28793615,0.9776,0.9452,0.672,0.6518
- chart_1 [normal bargraph] AverageDepth (the same as the minimal dataset example)
- chart_2 [stacked bargraph] ReadLengthR1, ReadLengthR2 (the same as the previous example)
- chart_3 [normal bargraph] MappedReads divided by TotalReads (mapping ratio)
- chart_4 [stacked bargraph] 2xRatio, 10xRatio, 20xRatio, 30xRatio (subtracting the values of items below)
First, add these columns to the [result_format_qc] section in the configuration file.
[result_format_qc]
col_opt_id = Sample

# Columns used in the chart_1
col_opt_average_depth = AverageDepth

# Columns used in the chart_2
col_opt_read_length_r1 = ReadLengthR1
col_opt_read_length_r2 = ReadLengthR2

# Columns used in the chart_3
col_opt_mapped_reads = MappedReads
col_opt_total_reads = TotalReads

# Columns used in the chart_4
col_opt_ratio_2x = 2xRatio
col_opt_ratio_10x = 10xRatio
col_opt_ratio_20x = 20xRatio
col_opt_ratio_30x = 30xRatio
The column names of optional items can be set as col_opt_{keyword} = {actual column name}.
For a more detailed description on keyword, please refer to About keyword.
Next, add the [qc_chart_1], [qc_chart_2], [qc_chart_3], and [qc_cahrt_4] sections to the configuration file and fill the contents within it.
For the completed configuration file, please refer to example/qc_variation/paplot.cfg.
4-1. Simple normal bargraph
The [qc_chart_1] section is for a normal bargraph, and the contents should be filled as in the minimal dataset example.
4-2. Simple stacked bargraph
The [qc_chart_2] section is for a stacked bargraph, and the contents should be filled as in the previous example.
4-3. Normal bargraph (with numeric operations on columns)
The [qc_chart_3] section is a graph for mapping ratio (Mapped reads divided by Total reads).
[qc_chart_3]

# Titles
title = Mapped reads/Total reads
title_y = Rate

# Items for the graph
stack1 = {mapped_reads/total_reads}

# Colors and legends
name_set = Mapped reads/Total reads:#2478B4

# Pop-up information
tooltip_format1 = Sample:{id}
tooltip_format2 = {mapped_reads/total_reads:.2}
stack1 = {mapped_reads/total_reads}).{mapped_reads-total_reads}) and addition (e.g., {mapped_reads+total_reads}).tooltip_format2 = {mapped_reads/total_reads:.2}tooltip_format2 = Mapped: {mapped_reads}, Total: {total_reads}.4-4. Stacked bargraph (with numerical operations on columns)
The chart_4 section is a graph for sequence coverage.
[qc_chart_2]

# Title
title = Depth coverage
title_y = Coverage

# Items for the graph
stack1 = {ratio_30x}
stack2 = {ratio_20x-ratio_30x}
stack3 = {ratio_10x-ratio_20x}
stack4 = {ratio_2x-ratio_10x}

# Colors and legends
name_set = Ratio 30x:#2478B4, Ratio 20x:#FF7F0E, Ratio 10x:#2CA02C, Ratio 2x:#D62728

# Pop-up information
tooltip_format1 = ID:{id}
tooltip_format2 = ratio__2x: {ratio_2x:.2}
tooltip_format3 = ratio_10x: {ratio_10x:.2}
tooltip_format4 = ratio_20x: {ratio_20x:.2}
tooltip_format5 = ratio_30x: {ratio_30x:.2}
Here, we set the first stack (stack1) to ratio_30x, the second stack (stack2) to ratio_30x subtracted by ratio_20x, etc.
Then, execute paplot.
paplot qc {unzip_path}/example/qc_variation/data.csv ./tmp qc_variation \
--config_file {unzip_path}/example/qc_variation/paplot.cfg
5. Graph for selecting samples
Here, we add the graph for selecting samples (using the column AverageDepth).
If you wish to use other columns, it should be registered in the [result_format_qc] section of the configuration file (as col_opt_{name}).
Only one graph for selecting samples can be included.
Add the [qc_chart_brush] section to the configuration file and fill the contents within it.
[qc_chart_brush]
stack = {average_depth}
name_set = average:#E3E5E9
Then, execute paplot.
paplot qc {unzip_path}/example/qc_brush/data.csv ./tmp qc_brush \
--config_file {unzip_path}/example/qc_brush/paplot.cfg