Quick Start
In this section, we will learn to
- Install paplot
- Execute paplot with simple example data
- View the output reports
- Modify configuration files and use your own data.
1. Install paplot
paplot is confirmed to work on Python2.7 and Python 3.5.
At present, paplot requires only standard packages.
cd {the directory where you want to install paplot}
# for v0.5.4
wget https://github.com/Genomon-Project/paplot/archive/v0.5.4.zip
unzip v0.5.4.zip
cd paplot-0.5.4/

python setup.py build install
Confirmation of installation
Execute the following command.
paplot --version
If the following messages appears, the installation is successful.
paplot-0.5.4
For more detailed information on installation, please consult Install.
2. Execute paplot with simple example data
The basic commands of paplot are as follows:
For the description of detailed options, please consult paplot command.
paplot subcommand [--config_file CONFIG_FILE] [--title TITLE]
                  [--ellipsis ELLIPSIS] [--overview OVERVIEW]
                  [--remarks REMARKS]
                  input output_dir project_name
Required arguments
| subcommand: | The type of report to generate. Select from the following:
|
|---|---|
| input: | The input data table. |
| output_dir: | The directory wherein the output files of paplot are generated. |
| project_name: | The project name (used as the title of the output files). |
Please execute paplot using the prepared sample data.
cd {the path where paplot is installed}
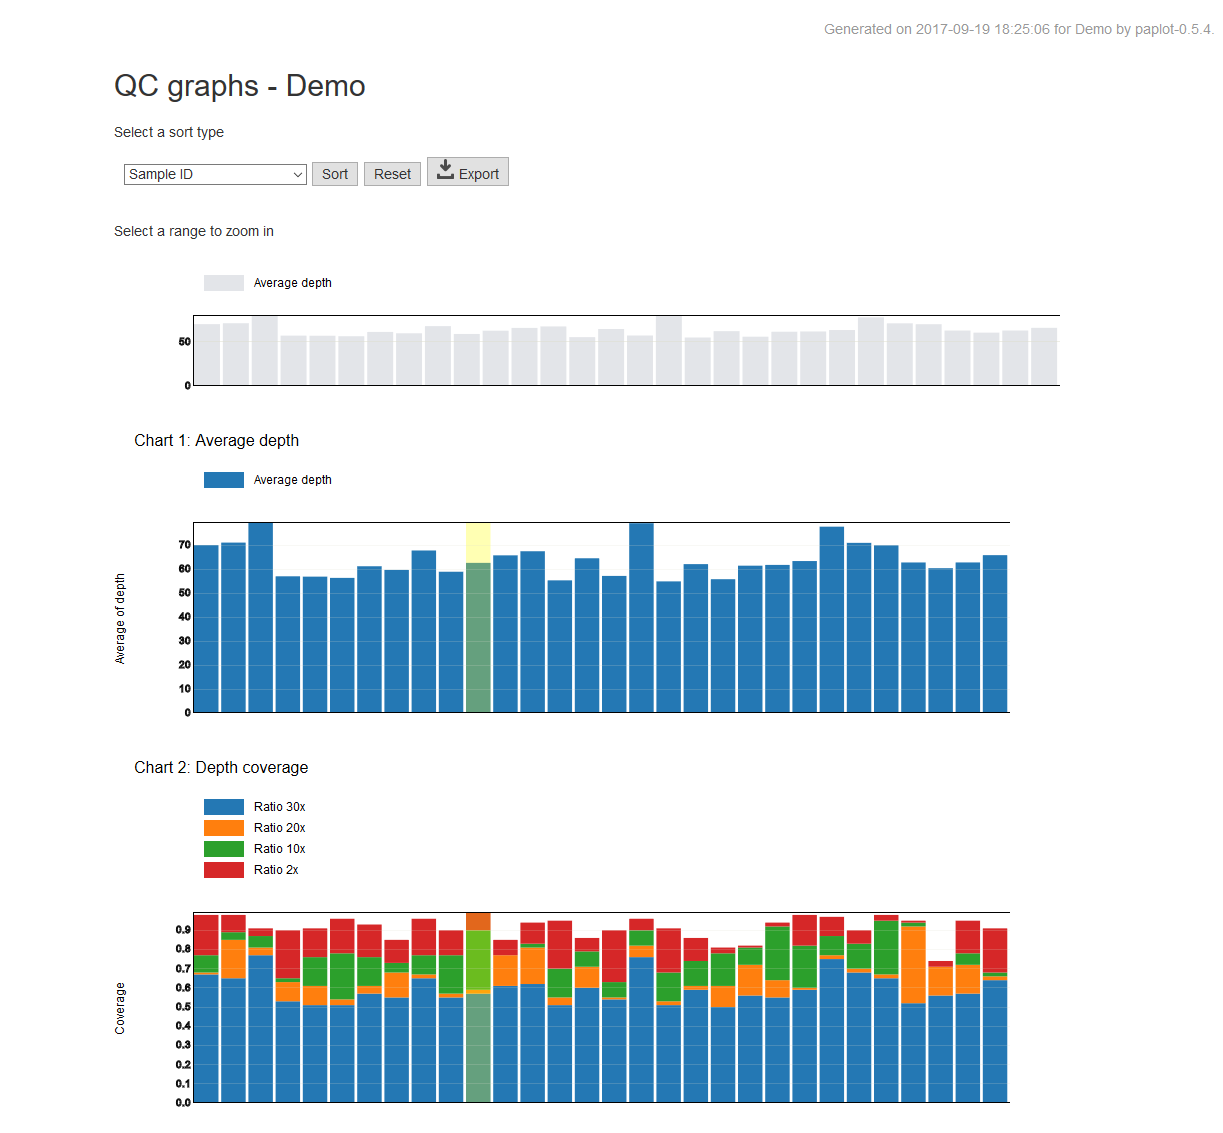
# QC Report
paplot qc example/qc_brush/data.csv ./tmp demo
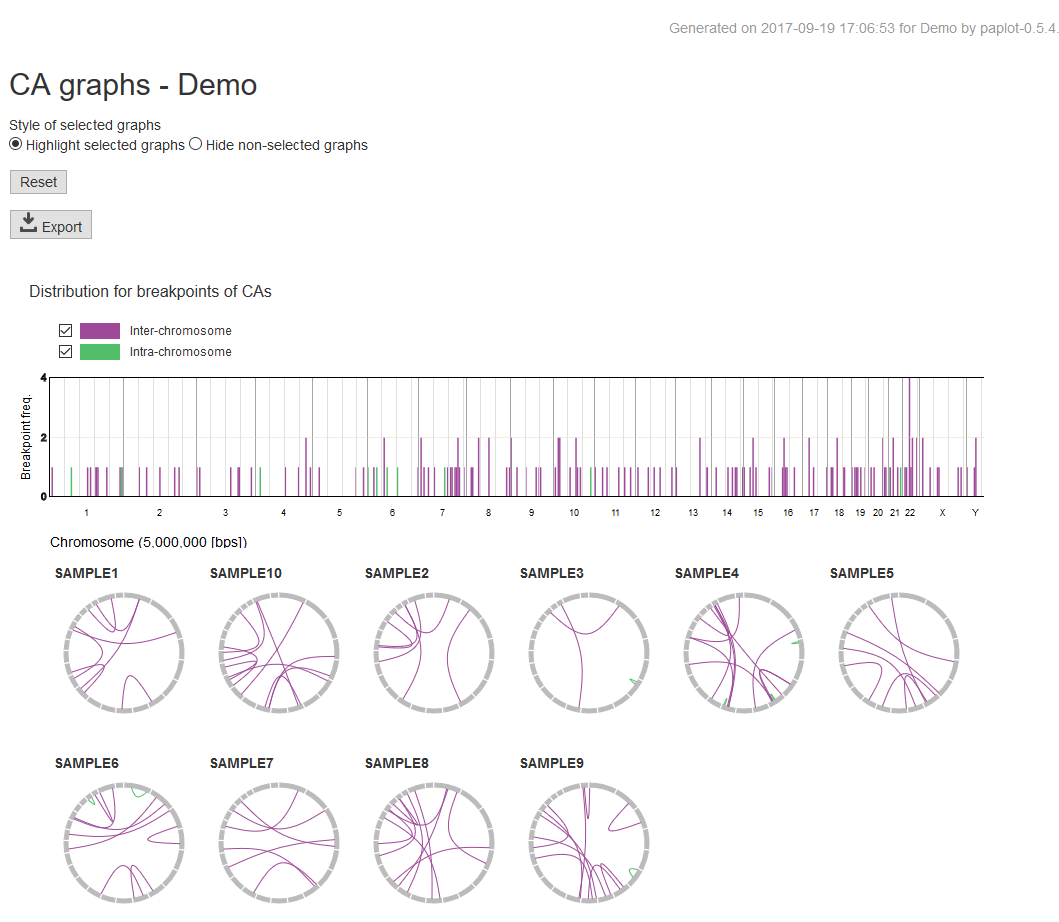
# Chromosomal Aberration Report
paplot ca example/ca_option/data.csv ./tmp demo
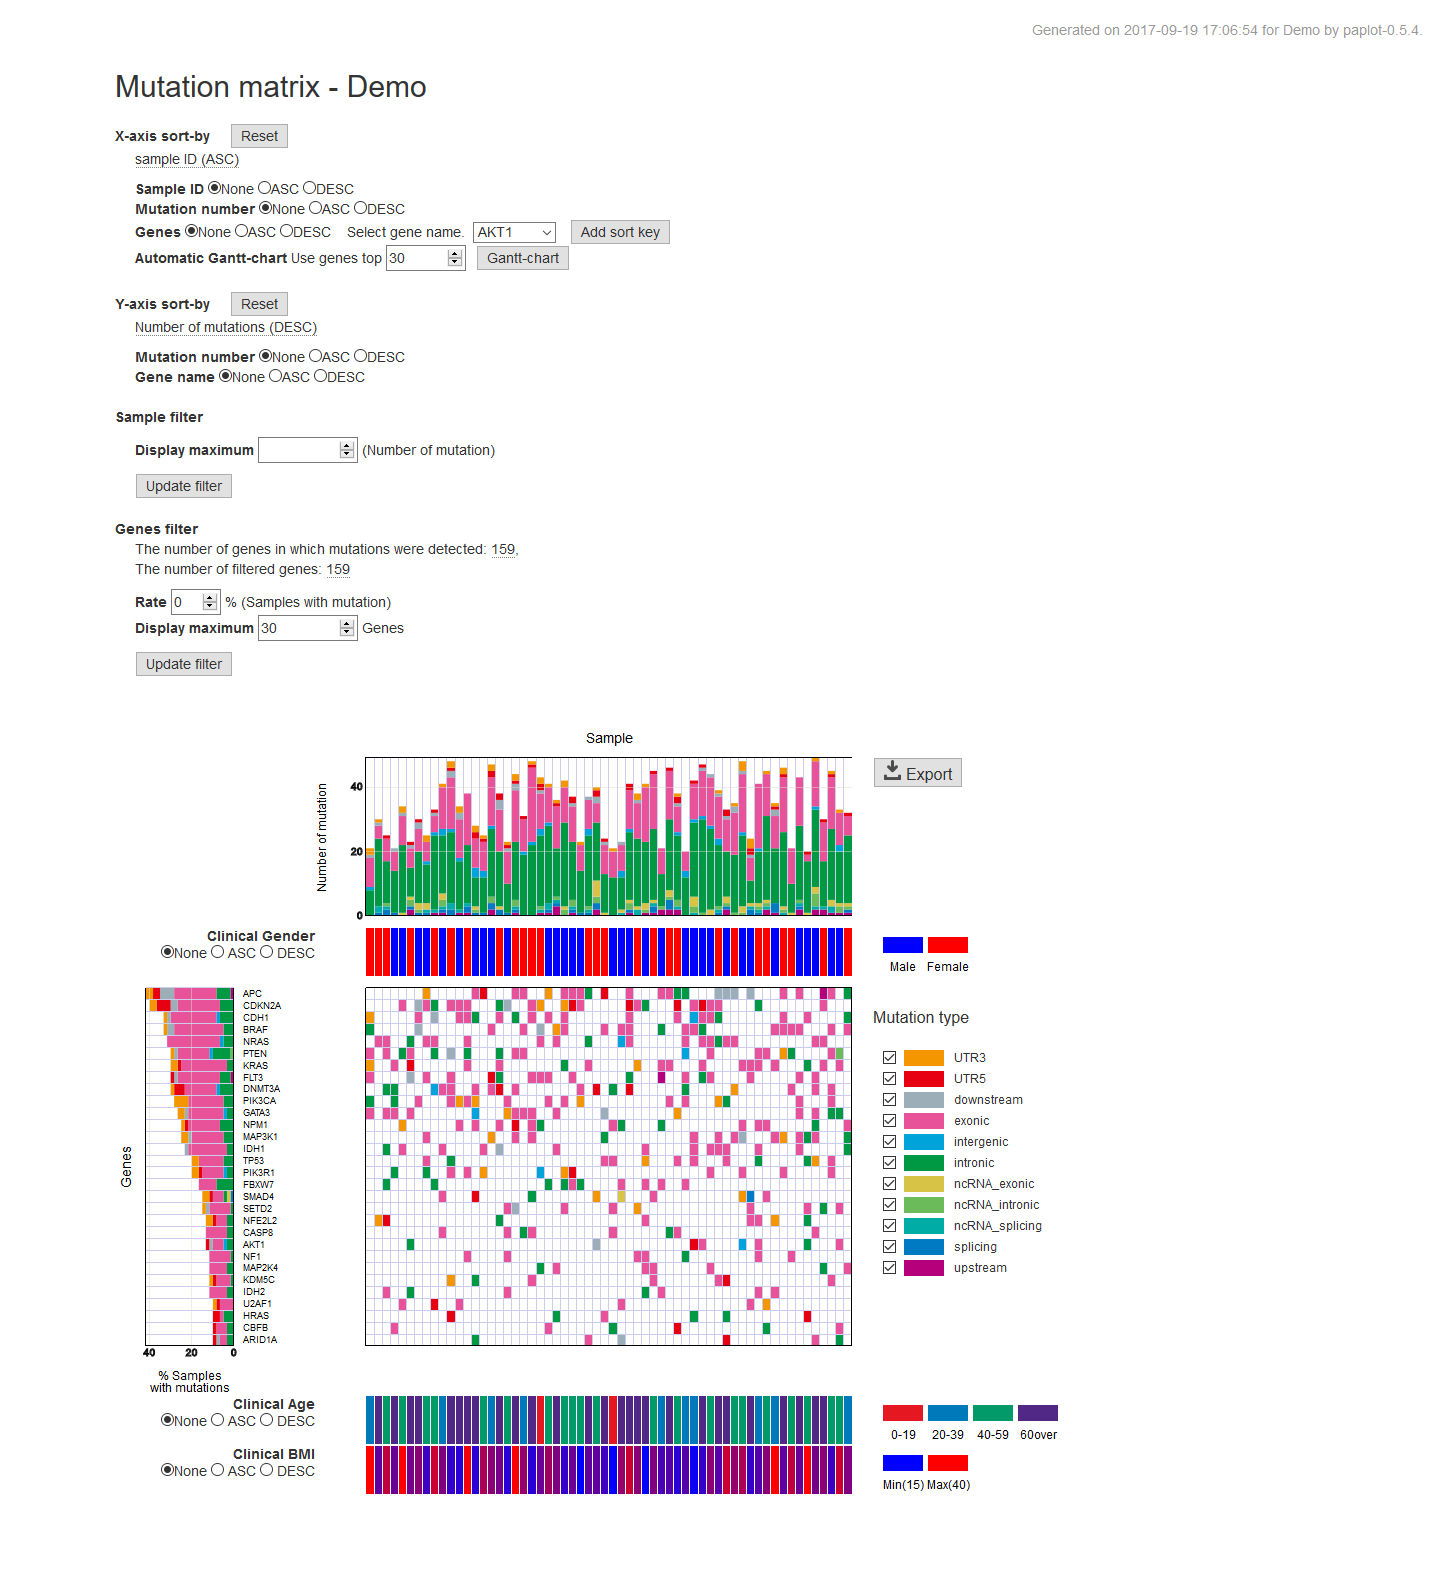
# Mutation Matrix Report
paplot mutation example/mutation_option/data.csv ./tmp demo
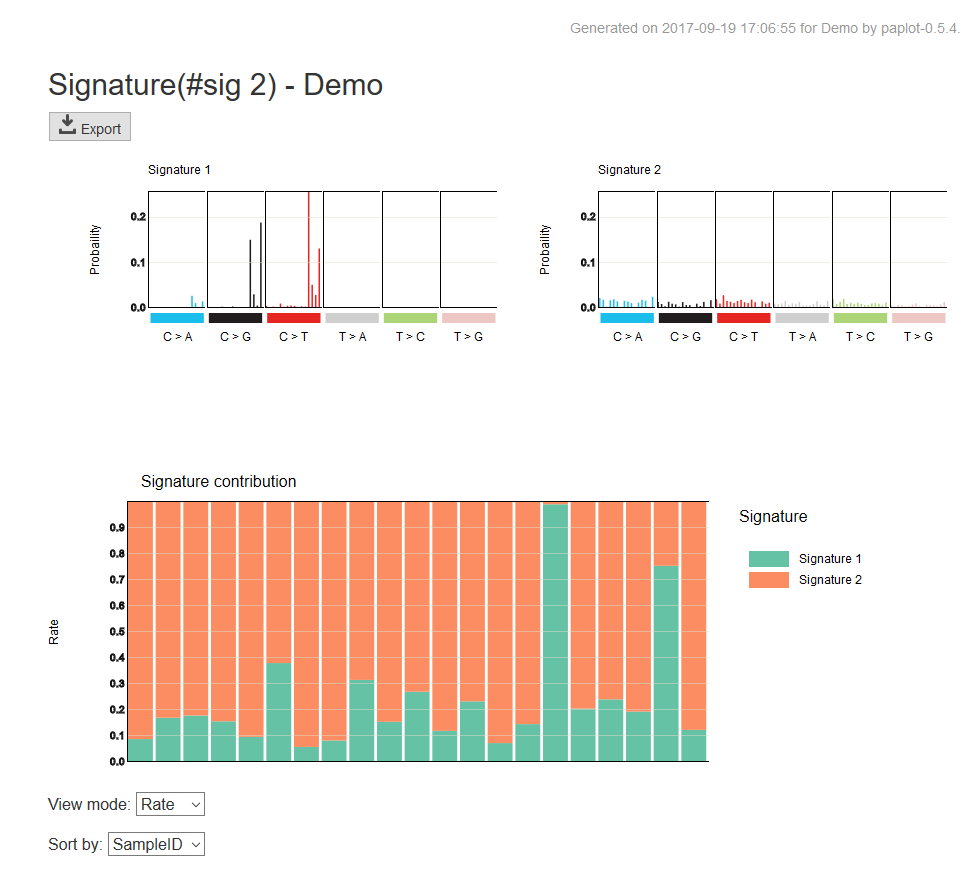
# Mutational Signature Report
paplot signature "example/signature_stack/data*.json" ./tmp demo
# pmsignature Report
paplot pmsignature "example/pmsignature_stack/data*.json" ./tmp demo
3. View the output file
You will find the following directory structure:
The directory specified by the {output_dir} argument
  ├ demo
  │   ├ graph_ca.html            <--- Chromosomal Aberration Report
  │   ├ graph_mut.html           <--- Mutation Matrix Report
  │   ├ graph_pmsignature2.html  <--- pmsignature Report (with varying number of mutation signatures)
  │   ├ graph_pmsignature3.html
  │   ├ graph_pmsignature4.html
  │   ├ graph_pmsignature5.html
  │   ├ graph_pmsignature6.html
  │   ├ graph_qc.html            <--- QC Report
  │   ├ graph_signature2.html    <--- Mutational Signature Report (with varying number of mutation signatures)
  │   ├ graph_signature3.html
  │   ├ graph_signature4.html
  │   ├ graph_signature5.html
  │   └ graph_signature6.html
  │
  ├ js          <--- The next four directories are necessary to display HTML files, Do not remove them.
  ├ layout
  ├ lib
  ├ style
  │
  └ index.html             <--- Open this file in a web browser.
Open index.html file in a web browser, and you will find the following reports.
QC Report
Chromosomal Aberration Report
Mutation Matrix Report
Mutational Signature Report
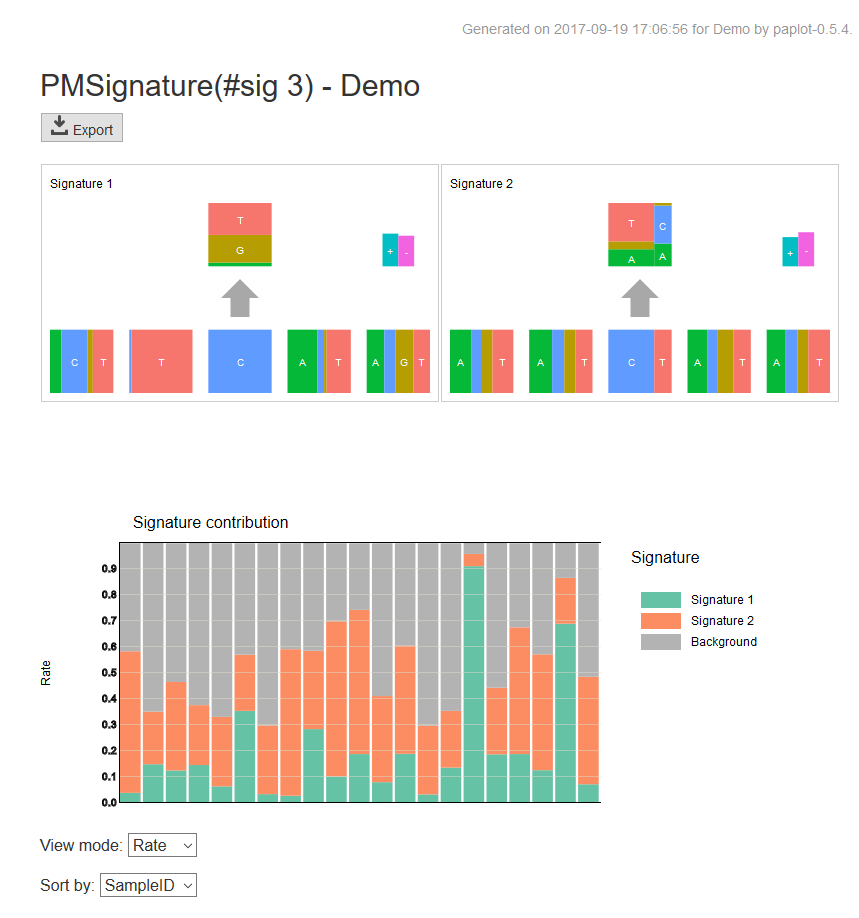
pmsignature Report
For how to interpret each graph, please refer to HOW TO USE GRAPHS.
Modify configuration files and use your own data
Please consult the following links to set up your own data and configuration files.
[For basic use]